Weather impacts on cricket run totals in T20 domestic leagues: tracking atmospheric data shifts for over-under wager calibration
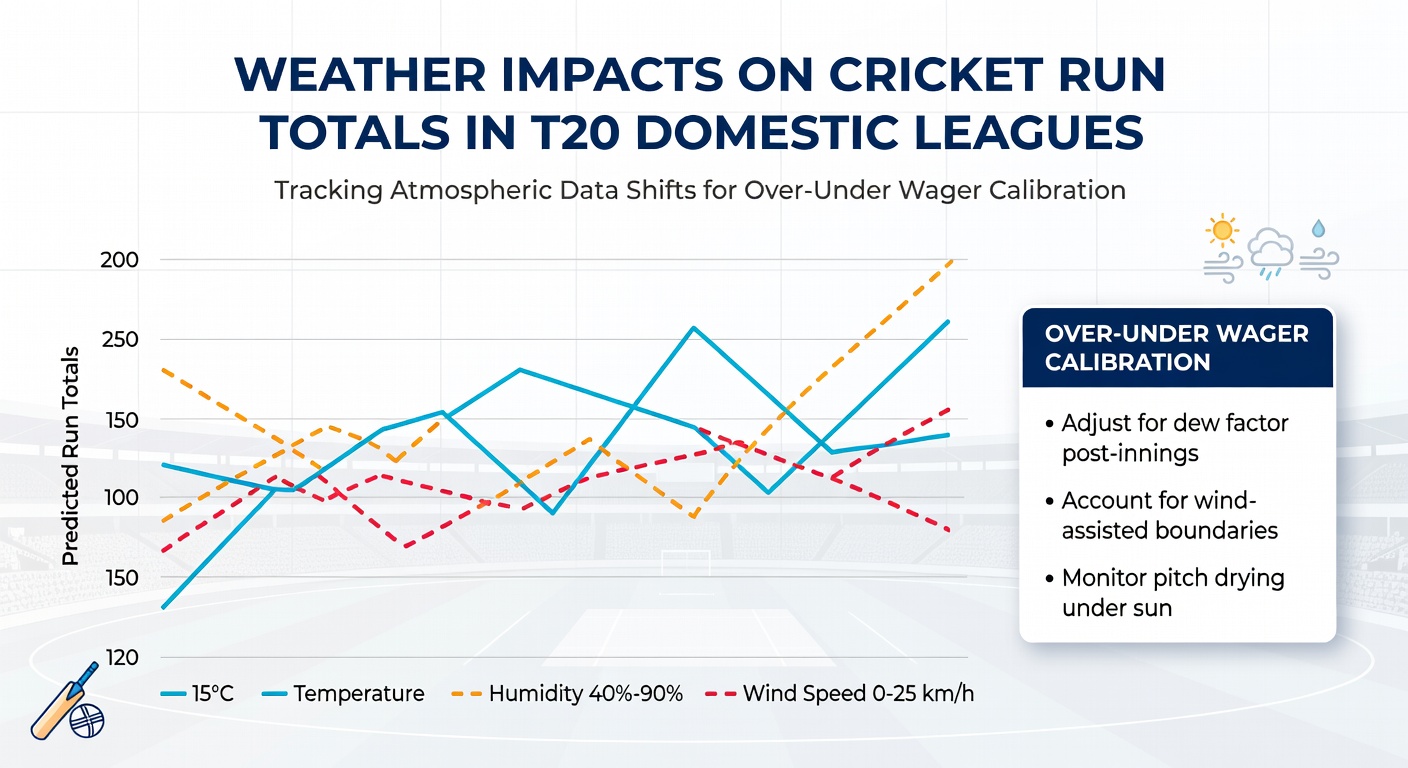
Atmospheric conditions shape run totals across T20 domestic leagues because temperature, humidity, air density, and wind patterns alter ball behavior, pitch moisture, and player endurance in measurable ways. Data collected from venues in the Indian Premier League, Big Bash League, and Caribbean Premier League show consistent correlations between these variables and final scores, which allows calibration of over-under markets when models incorporate real-time meteorological inputs.
Temperature effects on batting and bowling dynamics
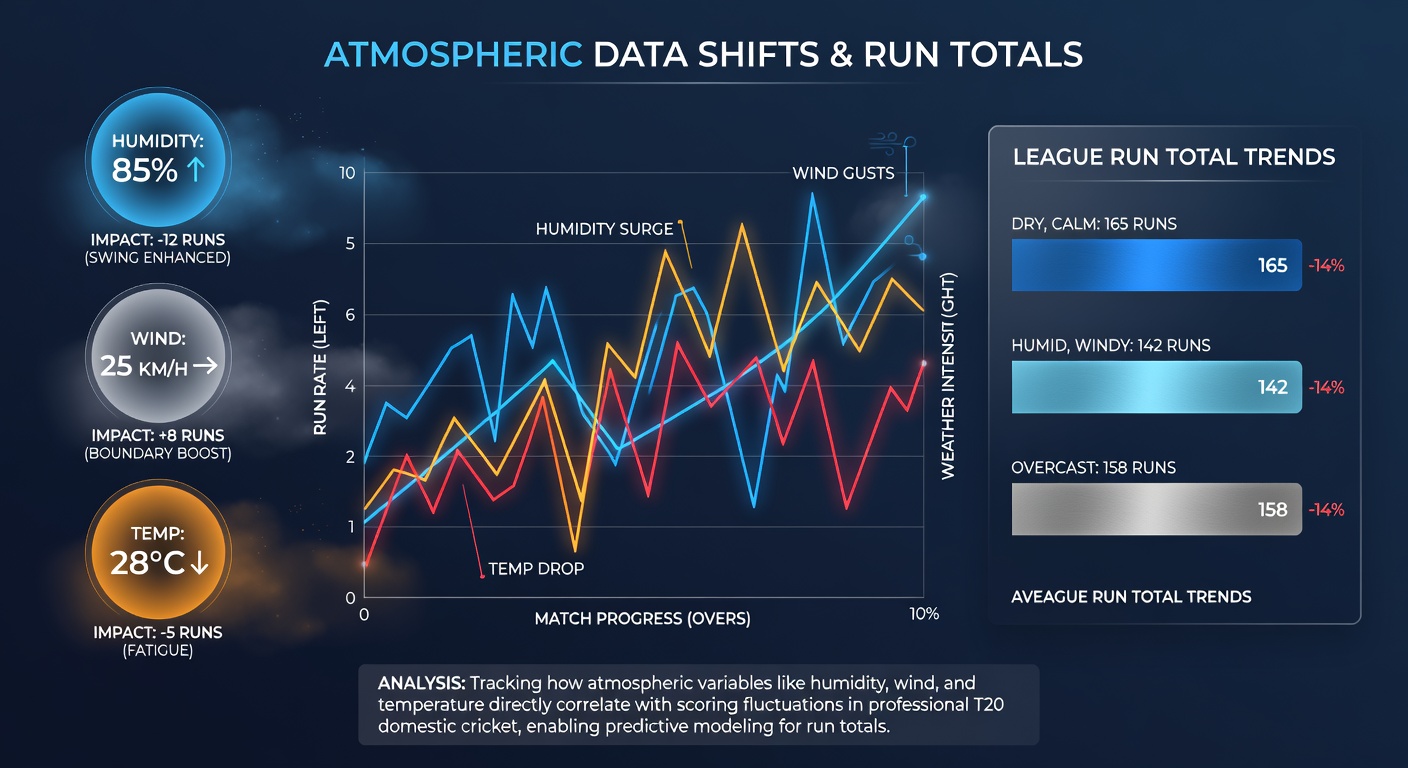
Higher temperatures reduce air density, which permits the ball to travel farther after contact with the bat while also decreasing swing movement for seam bowlers. Records from multiple T20 seasons indicate that matches played above 32 degrees Celsius produce average first-innings totals 12 to 18 runs higher than those contested below 25 degrees Celsius, particularly on pitches that retain less moisture. Observers note that bowlers adjust lengths earlier in such conditions, leading to more boundary opportunities in the middle overs.
Humidity and its influence on grip and swing
Relative humidity levels above 70 percent increase moisture content in the air and on the ball surface, which reduces grip for spinners and limits conventional swing for fast bowlers. Studies from the Indian Institute of Tropical Meteorology demonstrate that elevated humidity correlates with lower run rates in the powerplay because the ball grips the surface longer and deviates less off the pitch. Conversely, humidity drops below 50 percent often coincide with drier pitches that offer extra bounce, pushing totals upward as batters capitalize on lofted shots.
Wind patterns and boundary dimensions
Wind direction relative to the playing area affects carry on lofted shots and the amount of swing generated by seamers. Data from venues with short boundaries on one side reveal that strong crosswinds can add or subtract up to 15 runs from expected totals depending on which end faces the breeze. Meteorologists track gust speeds and vector changes hourly because sudden shifts during an innings frequently alter the over-under line mid-match.
Precipitation forecasts remain central to calibration because even light rain or dew formation changes outfield speed and ball condition. When dew settles after sunset, spinners lose purchase on the ball while batters find the surface quicker, a pattern documented across multiple evening T20 fixtures. Ground staff measurements combined with radar data allow models to adjust totals predictions downward when rain interruptions shorten the game or upward when the outfield remains firm.
Atmospheric data integration for wager calibration
Operators and analysts combine satellite readings, ground station logs, and venue-specific sensors to generate probability distributions for run totals. These distributions update every 30 minutes during the lead-up to a fixture, incorporating parameters such as dew point spread, barometric pressure trends, and ultraviolet index that influence player fatigue. Research published by the World Meteorological Organization highlights how micro-climate variations within a single stadium can shift expected scores by more than 20 runs when wind and humidity gradients are accounted for.
Domestic leagues in different regions apply these methods at varying scales. The Big Bash League publishes detailed pitch and weather reports that feed directly into statistical models, while leagues in South Asia rely more heavily on mobile sensor arrays because monsoon transitions create rapid changes. Calibration improves when historical match data from at least five seasons is layered with current atmospheric readings, producing narrower confidence intervals around over-under thresholds.
Case examples from recent seasons
During June 2026 fixtures in select T20 domestic competitions, elevated temperatures and low humidity at coastal venues produced first-innings scores consistently above 180, whereas inland grounds with higher moisture retained lower totals despite similar squad strengths. Analysts tracking these patterns adjusted opening lines by eight to ten runs when dew point forecasts crossed key thresholds, demonstrating the practical value of continuous atmospheric monitoring.
Another instance involved strong evening winds at a Caribbean venue that reduced effective boundary distances on one side, pushing totals higher than pre-match estimates. Live data feeds allowed recalibration before the second innings began, illustrating how real-time integration prevents static lines from lagging behind actual conditions.
Conclusion
Atmospheric data shifts provide measurable edges for calibrating over-under wagers in T20 domestic leagues because temperature, humidity, wind, and precipitation each exert documented effects on run totals. Continuous tracking through ground sensors, satellite inputs, and historical overlays enables precise adjustments across venues and seasons. As meteorological networks expand coverage and leagues release more granular environmental reports, these calibration methods gain further accuracy without relying on subjective assessments.