Observing Fatigue Indicators in Formula One Race Pace for In-Running Betting
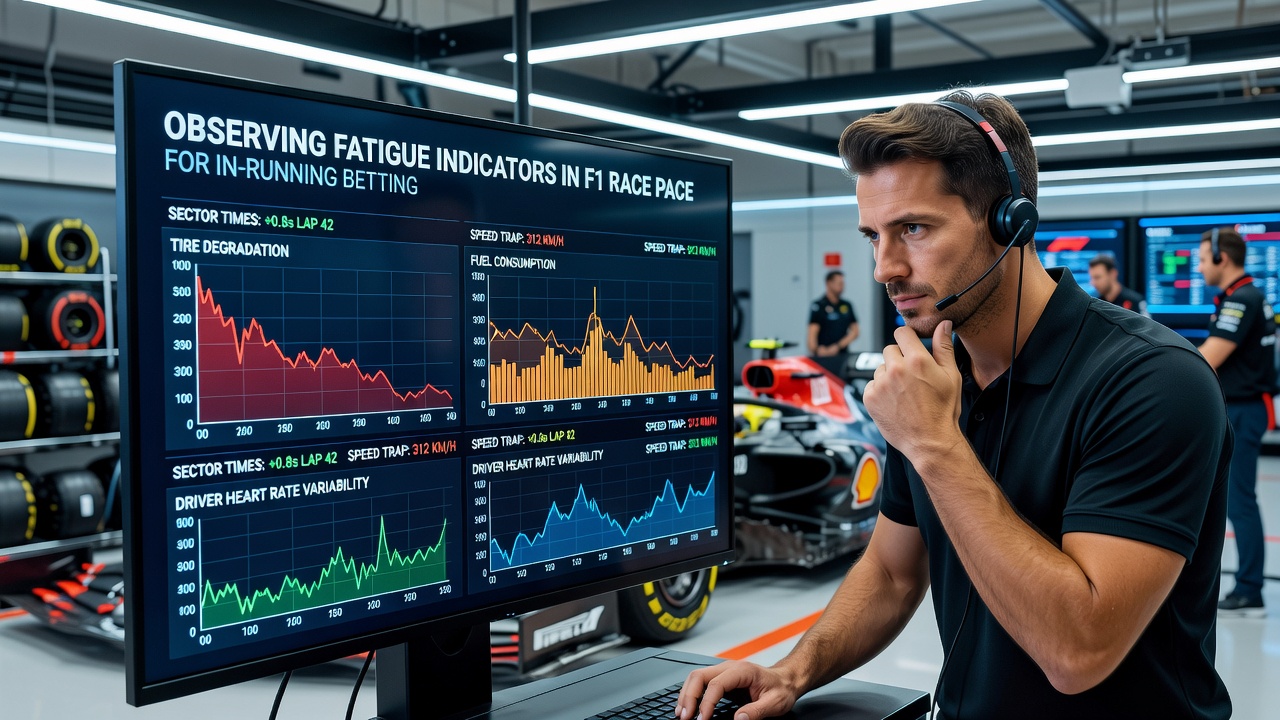
Formula One races stretch driver concentration and physical endurance across two hours or more, and observers track how lap times evolve to spot when fatigue begins to influence pace. Data from onboard telemetry reveals consistent patterns where early-race consistency gives way to gradual slowing as sessions progress, and those who monitor these shifts gain edges in live betting markets that adjust quickly to visible changes on track.
Tracking Lap Time Consistency Throughout a Grand Prix
Race engineers monitor sector splits and overall lap averages to identify when a driver starts losing rhythm, and this information flows into timing screens that update every few seconds. Early stints often show tight clusters of lap times within a narrow window, yet as rubber degrades and physical demands accumulate the spread widens noticeably. In July 2026 the season calendar placed several hot-weather events in quick succession, and those conditions accelerated the onset of measurable slowdowns in the second half of grands prix.
Telemetry systems record steering inputs, throttle application, and brake pressure, all of which become less precise when fatigue sets in. Researchers at motorsport performance labs have documented how these metrics drift together rather than in isolation, creating composite signals that experienced analysts cross-reference with live timing data. The result is a clearer picture of which drivers maintain control longest and which ones begin to cede ground lap by lap.
Physical and Cognitive Signals Visible in Pace Data
Heart-rate monitors fitted inside helmets provide one layer of insight, yet the most accessible indicators remain those captured by timing systems already available to bettors. A driver who posts sector times that drift upward by several tenths over a ten-lap window often signals rising fatigue, especially when compared against teammates running the same strategy. Observers note that such drift tends to accelerate after the halfway mark, when cumulative g-forces and cockpit heat compound the load.
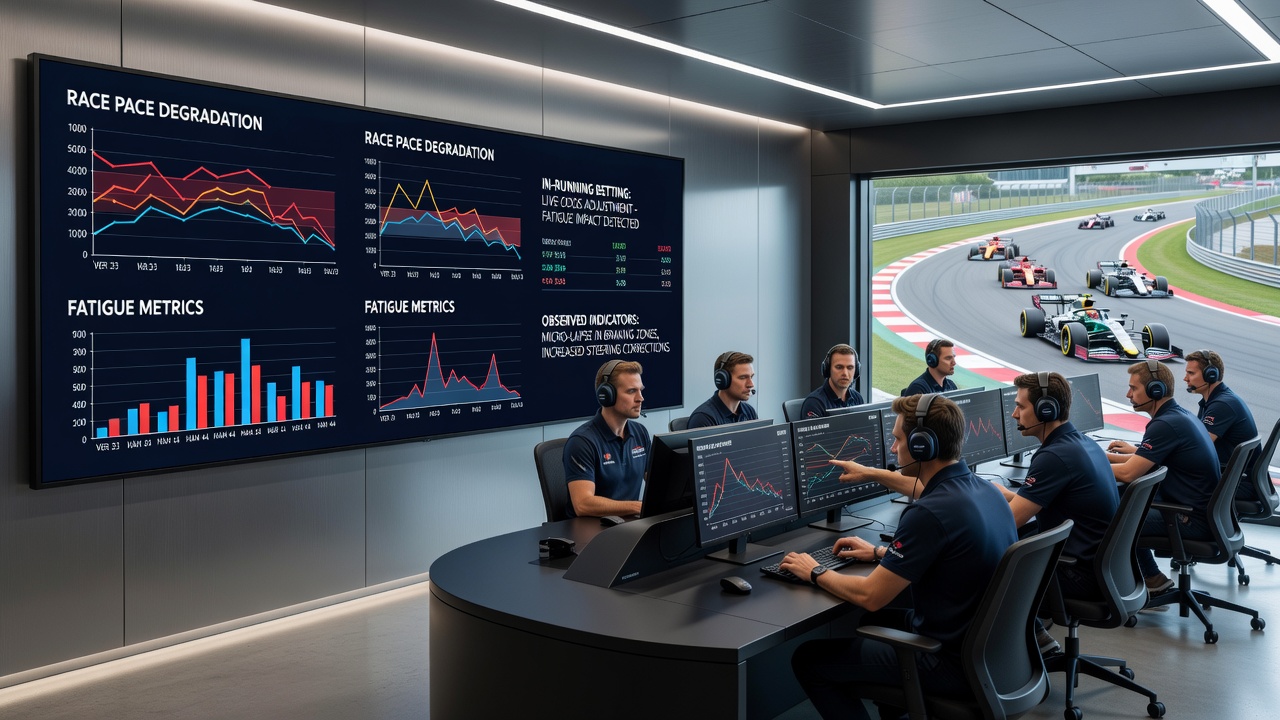
Braking traces offer another window: initial firm applications give way to earlier or softer inputs as reaction times lengthen. Data collected across multiple seasons shows these patterns appear reliably in races exceeding seventy laps, and they correlate with increased off-track moments or lock-ups that safety car periods sometimes mask. Analysts combine these observations with tire-wear models to separate mechanical degradation from human factors.
Integrating Fatigue Observations into Live Markets
In-running betting platforms adjust odds on race winners, podium finishes, and fastest-lap markets as soon as pace anomalies register on timing screens. When a frontrunner’s lap times begin to climb steadily while rivals maintain theirs, market makers respond by lengthening odds on the fading driver and shortening those on pursuers. Those who follow sector-by-sector updates can anticipate these movements before broader consensus forms.
Strategy calls such as pit-window adjustments also reflect fatigue considerations, because teams weigh whether a driver can defend position over remaining stints. Historical datasets from the FIA archive illustrate how late-race position swings frequently trace back to measurable pace erosion rather than mechanical failure alone. Bettors who overlay fatigue curves onto expected tire-life graphs therefore refine their entries into markets that move on small margins.
Regional Regulatory Context and Data Standards
European motorsport authorities publish technical bulletins that standardize telemetry formats, ensuring consistent data streams across events held on different continents. These standards support third-party analysis tools used by professional traders and casual observers alike. In parallel, performance institutes in Australia have contributed longitudinal studies on driver workload that complement European datasets, allowing cross-validation of fatigue thresholds identified in hot-climate races.
Because 2026 regulations altered power-unit deployment and aerodynamic balance, some teams reported shifts in cockpit workload that manifested as earlier onset of pace variability. Publicly released engineering notes from those events provide additional reference points for anyone mapping fatigue indicators against regulatory changes.
Conclusion
Formula One timing data contains layered signals that reveal when driver fatigue begins to alter race pace, and those signals translate directly into opportunities within in-running betting environments. Observers who combine sector trends, braking consistency, and comparative stint analysis build repeatable frameworks for interpreting live developments. As regulatory and environmental variables continue to evolve, the core practice of monitoring how lap times drift remains a stable foundation for informed decision-making across successive seasons.