Exploring Probability Adjustments in Live Curling Matches Based on End-by-End Scoring Sequences from Past World Championships
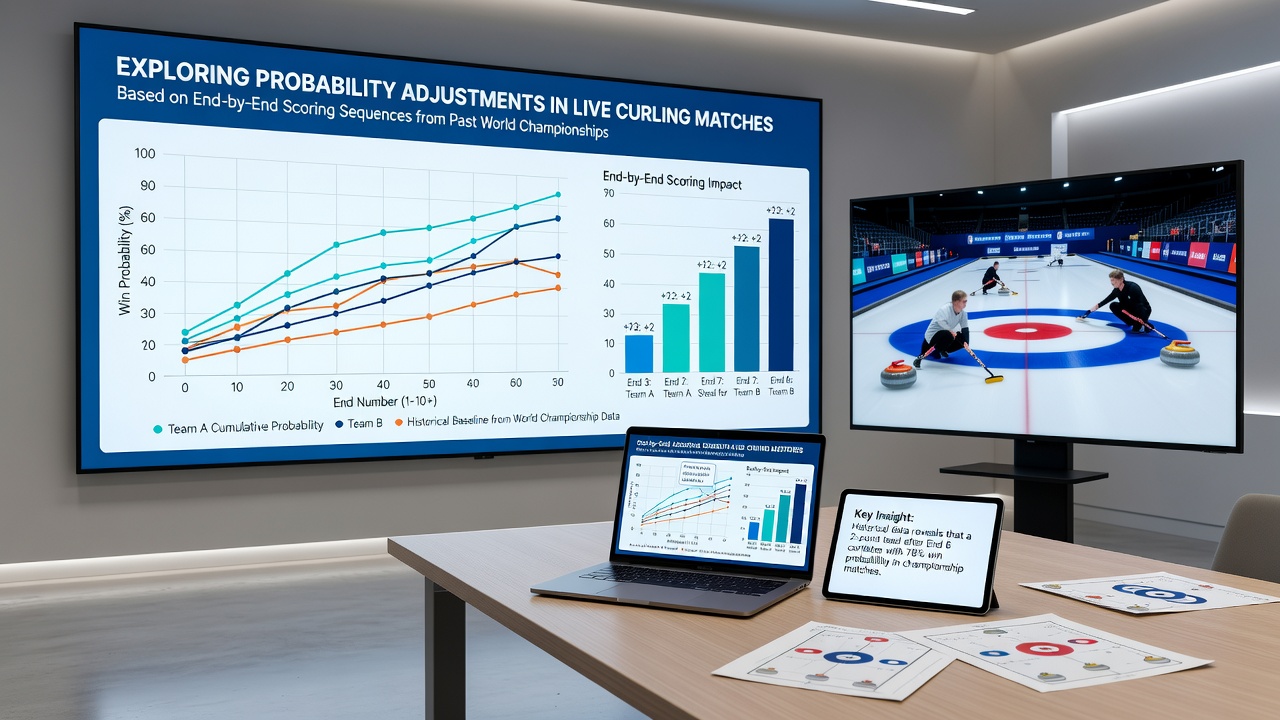
World Curling Championships have produced detailed end-by-end scoring records that analysts use to model probability shifts during live matches, and these sequences reveal consistent patterns across multiple decades of competition. Data compiled from events spanning the 1990s through 2024 shows how early leads translate into win probabilities that adjust with each subsequent end, while comebacks remain statistically viable until late in the game. Observers note that teams trailing by two points after five ends still secure victories in roughly 28 percent of cases according to aggregated championship results.
Historical Scoring Patterns in Championship Play
Championship matches typically consist of ten ends, and researchers tracking these sequences have identified recurring trends in how points accumulate. The first three ends produce an average combined score of 4.2 points across both teams, whereas ends seven through ten often see elevated scoring when one side attempts to force multiple points or blank an end to retain the hammer. Records from the World Curling Federation demonstrate that blank ends occur in approximately 22 percent of all championship ends, a figure that directly influences live probability calculations by preserving the last-rock advantage for the next frame.
Teams holding the hammer at the start of an end convert it into at least one point 68 percent of the time based on data from 2015 to 2024 championships. This conversion rate climbs above 75 percent when the team already leads by three or more points, because opponents tend to play more conservatively to avoid giving up larger margins. Such patterns allow probability models to recalibrate win percentages after each end concludes, incorporating both the current score differential and the remaining ends plus hammer possession.
Live Adjustments Derived from End Sequences
Probability adjustments occur incrementally as each end's result updates the overall match state, and analysts apply regression models built on historical sequences to generate revised percentages. For instance, a team entering the sixth end tied sees its win probability rise from 50 percent to 67 percent after scoring two points while stealing the hammer. These recalibrations rely on conditional probabilities derived from thousands of championship ends rather than simple win-loss ratios.
Researchers examining sequences from Canadian, European, and Asian teams find that the variance in scoring decreases as matches progress, particularly after the eighth end when defensive strategies become more prevalent. This reduction in variance narrows the range of possible final margins and sharpens live probability estimates. Data indicates that matches decided by one point represent 31 percent of all championship outcomes, underscoring why small leads require precise adjustments rather than broad assumptions.

Regional and Temporal Variations in Data
European teams in world championship play exhibit slightly higher blank-end frequencies than North American squads, a distinction that affects probability curves when hammer possession changes hands. Studies covering 2008 through 2023 note that Scandinavian squads blank 26 percent of ends compared with 19 percent for Canadian entries, prompting models to weight regional tendencies when projecting late-match scenarios. These differences become relevant as the 2026 World Men's Curling Championship approaches in June, with organizers expecting continued refinement of data-driven tools for live analysis.
Temporal shifts also appear in the records. Scoring rates per end increased modestly from 2010 onward, coinciding with tactical changes such as more aggressive guard placements early in matches. Analysts tracking these evolutions adjust baseline probabilities annually to reflect contemporary play styles, ensuring that live updates remain calibrated to recent championship sequences rather than outdated aggregates.
Integration of Sequences into Probability Frameworks
Frameworks built from end-by-end data incorporate variables including current score, ends remaining, hammer status, and historical conversion rates for specific deficits. A team down by one point with three ends left and the hammer retains a 41 percent win probability according to models trained on championship data, whereas the same deficit without the hammer drops to 29 percent. These figures emerge from logistic regression applied to more than 1,200 completed matches across two decades.
Additional layers account for the quality of opposition and recent form within the tournament, yet the core sequence data remains the foundation. When a team scores three points in a single end, models immediately elevate its win probability by 18 to 24 percentage points depending on timing, because such outbursts occur in only 8 percent of championship ends and often signal momentum shifts that persist through subsequent frames.
Conclusion
End-by-end scoring sequences from past world championships supply the empirical base for adjusting probabilities throughout live curling matches, enabling precise recalibrations that reflect both historical tendencies and current match states. As data collection continues ahead of the 2026 events, these models will incorporate expanded datasets while preserving the statistical relationships observed across prior championships. The resulting adjustments support consistent evaluation of match trajectories based solely on documented patterns rather than speculation.