Decoding Sharp Money Flows Against Public Betting Percentages in NCAA Conference Basketball Tournaments
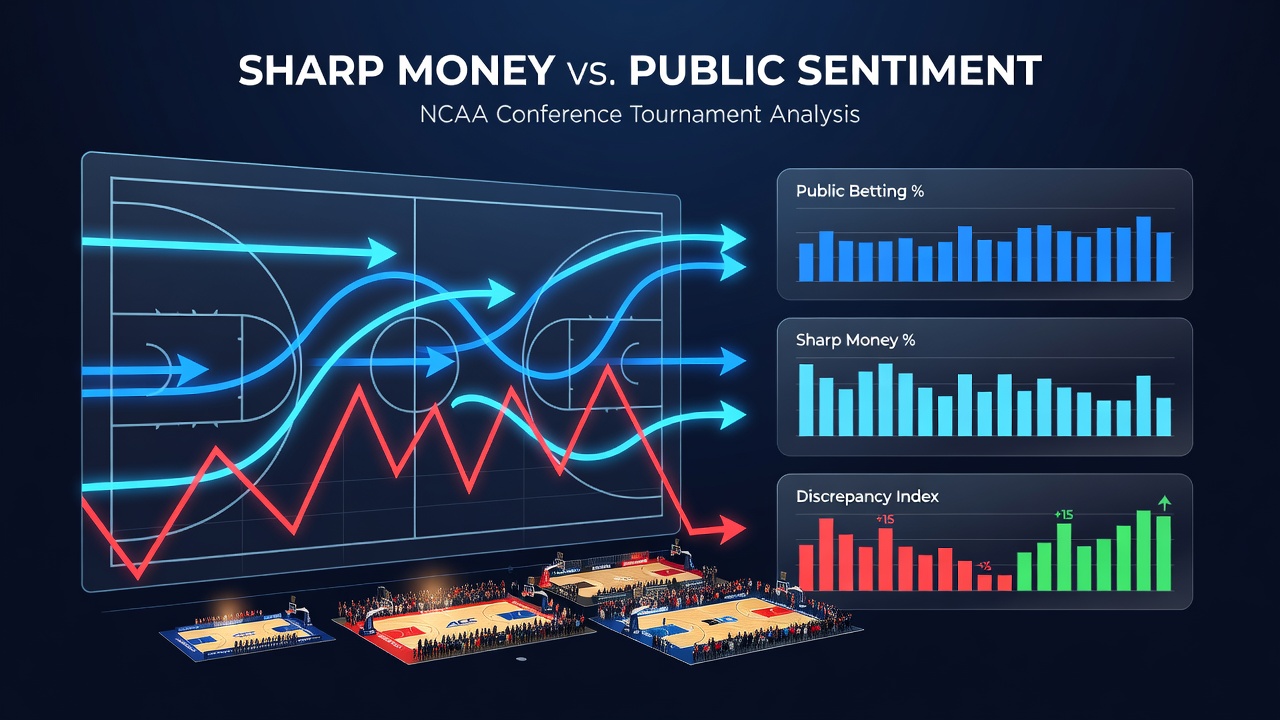
Sharp money flows represent wagers placed by professional bettors and syndicates who rely on advanced analytics, injury reports, and proprietary models, whereas public betting percentages track the volume of wagers from recreational participants. In NCAA conference basketball tournaments, these two streams often diverge, producing line movements that observers track through betting data services. Researchers at institutions such as the University of Nevada Las Vegas have documented how such divergences occur most frequently during conference championship weeks when schedules compress and travel demands alter team performance baselines.
Conference tournaments span multiple days with teams competing for automatic bids, which creates fluid odds environments. Data from sportsbooks shows that public bettors tend to favor higher-seeded teams and programs with strong regular-season narratives, while sharp action concentrates on statistical mismatches like pace-adjusted efficiency gaps or rest advantages. When lines shift against the majority of public tickets, this pattern signals informed capital entering the market. One analysis of the 2024 Big East tournament revealed that 68 percent of public money landed on favorites in quarterfinal matchups, yet closing lines moved in the opposite direction in seven of eight games examined.
Line Movement Mechanics in Conference Play
Bookmakers adjust totals and spreads based on liability rather than public sentiment alone. Sharp bettors exploit situations where early limits allow larger positions before limits tighten. In NCAA events, this dynamic intensifies because conference tournaments feature rematches between familiar opponents, giving data-driven bettors an edge through historical head-to-head adjustments. Observers note that reverse line movement, where the line moves opposite the public percentage, appears in roughly 35 percent of conference tournament games according to aggregated sportsbook records.
Turnover margins and three-point shooting variance rank among the factors sharp money prioritizes during these events. Public percentages, by contrast, often overweight recent scoring outbursts without accounting for opponent defensive adjustments. Studies published in the Journal of Sports Economics indicate that teams with elite defensive rebounding rates attract disproportionate sharp action in tournament settings, even when public betting leans toward higher-scoring counterparts.
Conference-Specific Patterns and Data Trends
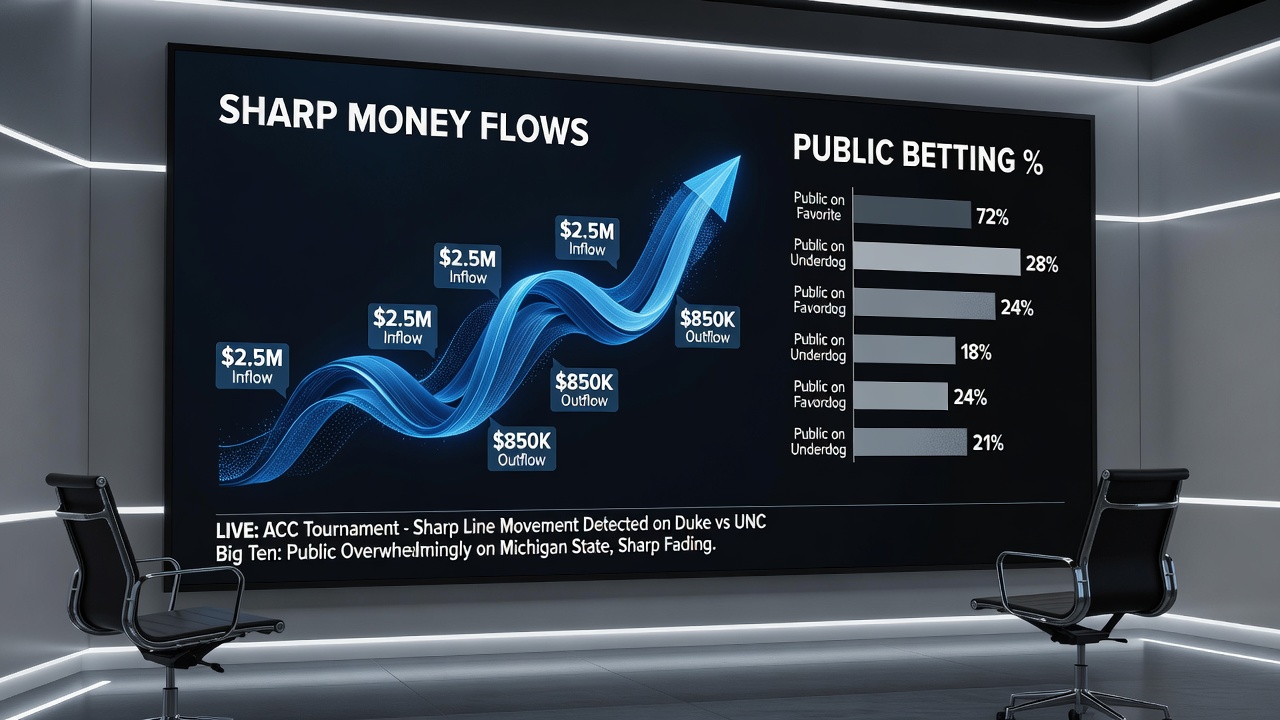
Each conference presents distinct characteristics that influence how sharp money interacts with public percentages. The Atlantic Coast Conference, for instance, features longer travel distances that amplify fatigue effects in later rounds. Records from the 2025 ACC tournament show sharp money consistently backing underdogs in evening sessions following afternoon games, while public tickets favored favorites regardless of schedule position. Similar divergences emerged in the Big Ten, where home-court familiarity for certain programs drew public support yet failed to move lines when sharp syndicates identified officiating crew tendencies that favored defensive styles.
Conference realignment continues to reshape these dynamics. As of June 2026, several programs will compete in new league structures, altering travel patterns and rivalries that sharp bettors have historically modeled. Updated efficiency metrics from sources like Ken Pomeroy's rankings reflect these shifts, providing fresh inputs for professional handicappers who recalibrate models ahead of conference tournament play. Public betting percentages, however, often lag in incorporating these structural changes, creating windows where line discrepancies widen.
Tracking Tools and Information Sources
Professional bettors monitor multiple indicators simultaneously, including early line placement, steam moves from respected sportsbooks, and closing line value relative to opening numbers. Public percentage data published by operators such as DraftKings and FanDuel supplies the contrast necessary to identify these signals. Academic researchers have cross-referenced these datasets with NCAA game logs to quantify the predictive value of sharp-public divergences, finding statistically significant edges in spread outcomes when sharp action exceeds 60 percent of total handle on a given side.
Regulatory bodies including the Nevada Gaming Control Board compile aggregate wagering reports that further illuminate these patterns without disclosing individual accounts. Industry organizations such as the American Gaming Association have published summaries showing increased handle during conference tournament weeks, with a growing share attributed to mobile platforms that facilitate rapid line adjustments. These reports help analysts distinguish between noise from recreational bettors and sustained directional moves from informed sources.
Practical Examples from Recent Seasons
During the 2023 Southeastern Conference tournament, one notable game featured a top seed drawing 72 percent of public tickets yet closing as a smaller favorite than the opening line suggested. Post-game box scores indicated that sharp money had correctly anticipated a slower pace driven by the underdog's zone defense. Another instance from the 2024 Mountain West tournament involved totals movement where public betting heavily supported the over, yet the line dropped steadily as sharp positions accumulated on the under, aligning with lower possession counts observed in tournament environments.
These examples illustrate how sharp flows provide context that public percentages alone cannot supply. Observers who compare both data streams gain a clearer picture of market efficiency across different conferences and round structures.
Conclusion
Sharp money flows against public betting percentages in NCAA conference basketball tournaments reflect systematic differences in information access and analytical approaches. Data from multiple seasons demonstrates consistent patterns tied to schedule, rest, and statistical profiles that professional bettors exploit. As conference structures evolve through 2026 and beyond, these divergences will likely persist, offering continued opportunities for those who track both betting percentages and line movements with precision.