Deciphering Pitcher Workload Thresholds in MLB Doubleheaders and Their Influence on Run Line Adjustments
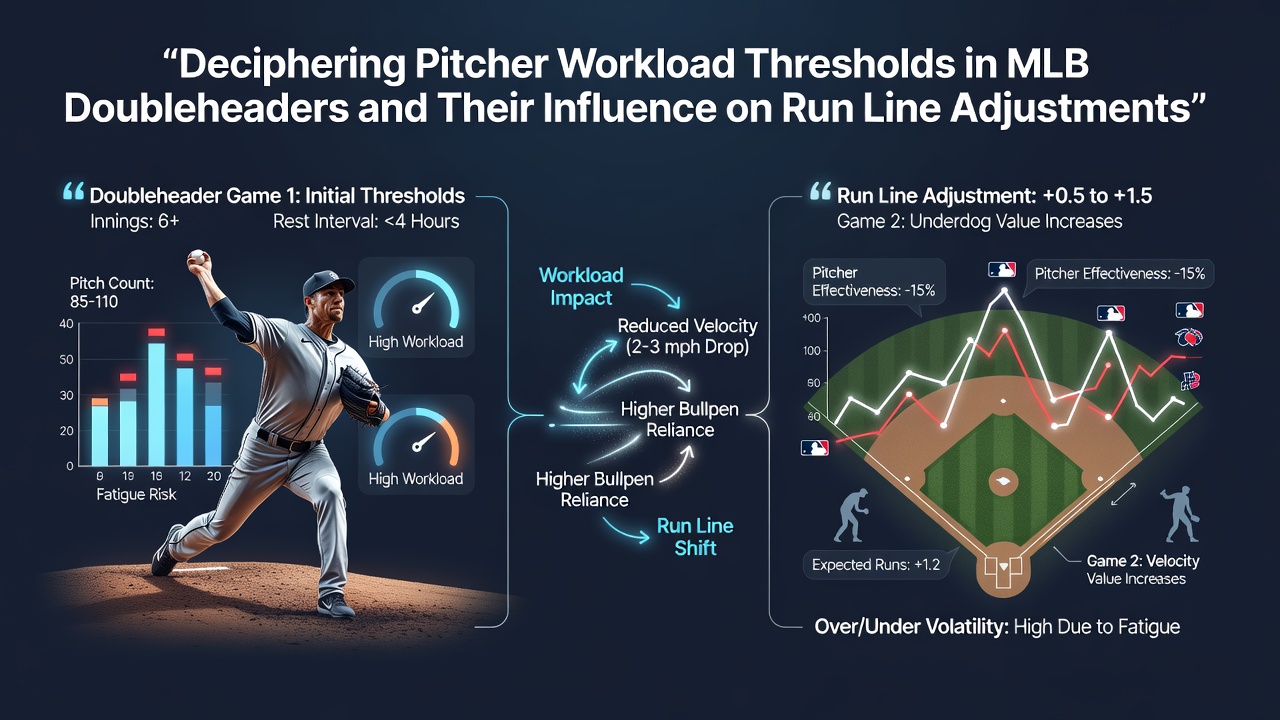
Major League Baseball schedules doubleheaders less frequently than in past decades yet they still occur when weather or other disruptions force teams to play two games in one day, and these contests create distinct challenges for pitching staffs that directly affect run line markets. Pitchers operate under strict workload guidelines developed from decades of injury data and performance tracking, with thresholds typically measured in pitch counts around 100 per outing for starters alongside innings limits that vary by age and role. When a team faces a doubleheader the rotation must split resources across both games, often requiring a starter to handle one contest while the bullpen absorbs heavier duties in the other.
Historical Context and Scheduling Realities
Doubleheaders once formed a regular part of the MLB calendar with teams completing twin bills on consecutive days during long homestands, but rule changes and expanded rosters have reduced their frequency. Data from the past ten seasons shows roughly 40 to 50 official doubleheaders per year across both leagues, concentrated in the summer months when rainouts accumulate. The 2026 schedule released in February includes several makeup dates clustered around the All-Star break, and observers note that July contests in particular test teams already managing high pitch volumes from the first half.
Pitcher Workload Thresholds Defined
Workload thresholds emerge from biomechanical studies and medical tracking programs that identify safe pitch totals before fatigue raises injury risk. Starters generally approach limits between 85 and 110 pitches depending on individual recovery profiles, while relievers face cumulative daily caps closer to 40 pitches across multiple appearances. Research published by the American Sports Medicine Institute tracks how exceeding these markers correlates with elevated elbow and shoulder strain rates in subsequent weeks. Teams therefore plan doubleheader assignments by designating a primary starter for game one and shifting to a swingman or opener for game two to keep total stress within monitored bounds.
Impact on Game Scoring Patterns
Statistical reviews of doubleheader games reveal measurable shifts in run production compared with standard single games. When both contests occur on the same day total runs per game rise by an average of 0.8 according to aggregated play-by-play databases maintained by MLB Advanced Media. This increase stems from shorter outings by starters and greater reliance on middle relievers who often post higher earned run averages under back-to-back stress. Run line bettors therefore encounter adjusted totals that reflect these elevated scoring environments, with sportsbooks frequently moving the over/under line upward by half a run in the second game of a twin bill.
Run Line Market Adjustments
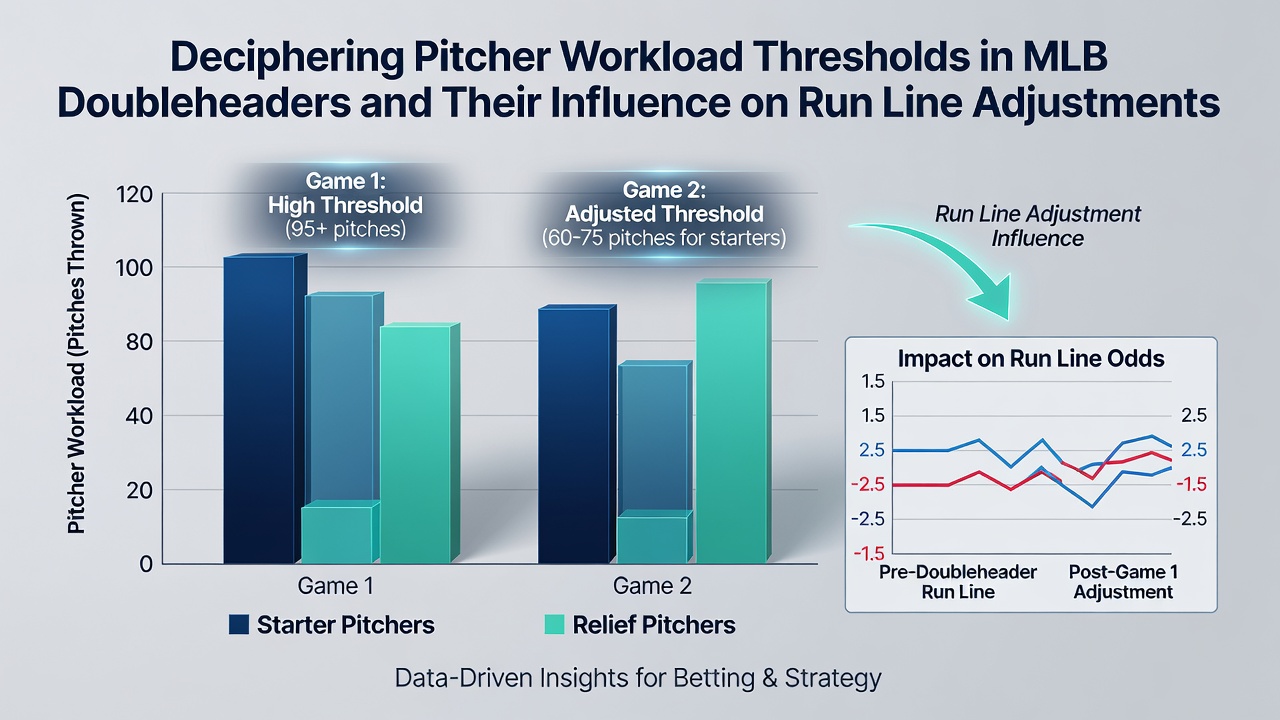
Betting markets respond to workload data through real-time line movements that incorporate expected bullpen fatigue and matchup disadvantages. When a team lists a pitcher nearing his seasonal innings high for the opener, oddsmakers widen the run line spread in the second game to account for potential late-inning vulnerability. Historical figures compiled by the Society for American Baseball Research indicate that teams using four or more pitchers in game one of a doubleheader allow 12 percent more runs in game two than teams that keep starter pitch counts under 80. These patterns prompt line adjustments that move run line prices by as much as 20 cents on either side depending on the specific rotation news released hours before first pitch.
Case Examples from Recent Seasons
One documented instance occurred in a 2024 doubleheader between the Chicago Cubs and Milwaukee Brewers where the Cubs starter reached 102 pitches in the opener, forcing the bullpen to cover six innings across both games. The second contest produced nine total runs, pushing the run line over the adjusted total that had been set at 8.5. Similar sequences appear in data sets covering the 2022 through 2025 campaigns whenever a club enters a doubleheader with a starter already on a restricted pitch count due to prior workload. Canadian researchers at the University of Waterloo have examined comparable athlete recovery metrics across multiple sports and note that baseball's daily double format creates unique cumulative stress profiles not seen in single-game schedules.
Monitoring Tools and Data Sources
Front offices and betting analysts rely on pitch-tracking systems such as Statcast along with internal recovery dashboards to forecast how workload thresholds will influence outcomes. These tools supply granular data on spin rates, velocity drops, and command metrics that degrade once a pitcher surpasses personal limits. As the 2026 season progresses through its July slate, teams continue refining these models to balance competitive needs against long-term arm health, and the resulting usage patterns feed directly into the run line pricing observed across major sportsbooks.
Conclusion
Doubleheaders compress pitching workloads into compressed timeframes that alter scoring distributions and prompt measurable run line adjustments based on established thresholds. Data from multiple tracking systems and historical reviews demonstrate consistent patterns in how teams allocate innings and how markets incorporate those decisions. Observers tracking the 2026 schedule can follow these dynamics through publicly available pitch count logs and daily lineup announcements that reveal the operational constraints driving both on-field results and betting line movements.