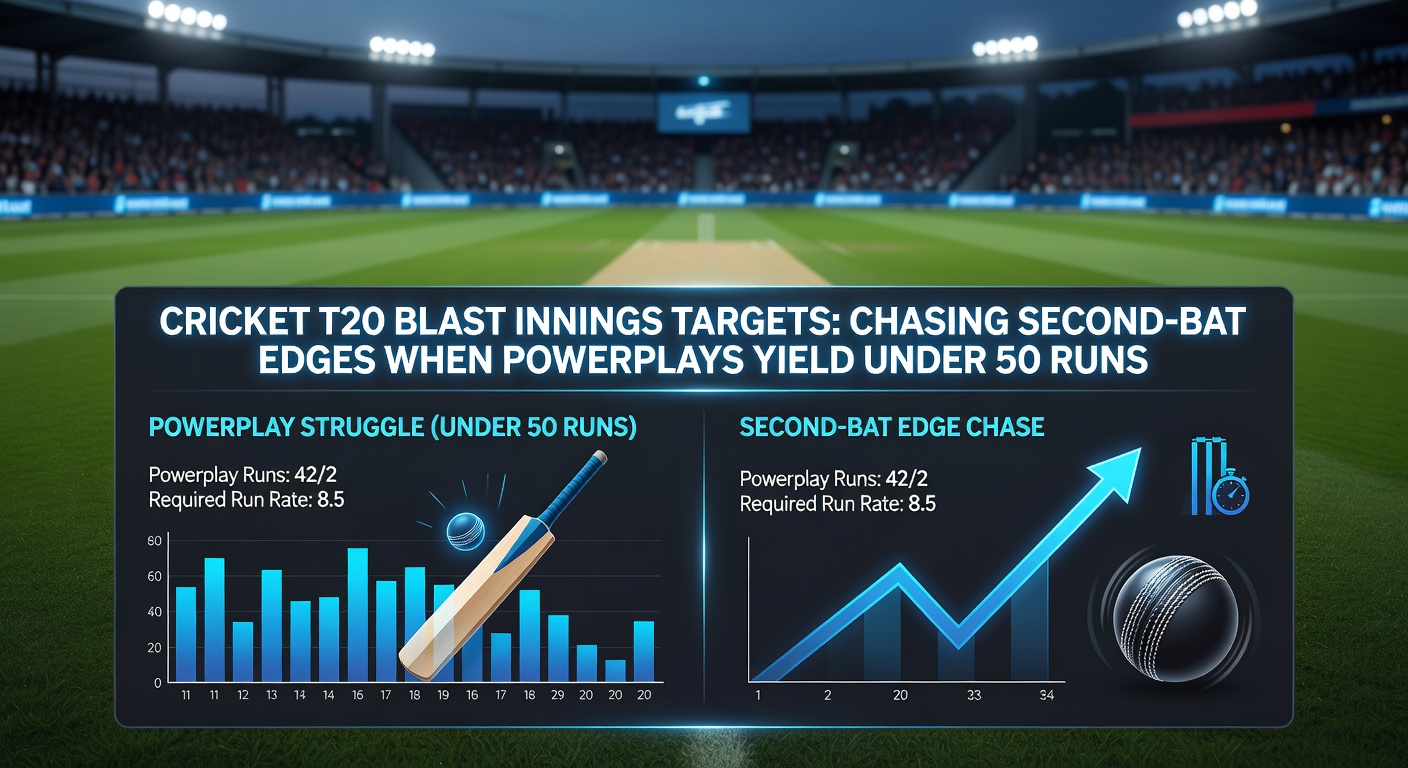
Cricket T20 Blast Innings Targets: Chasing Second-Bat Edges When Powerplays Yield Under 50 Runs
Cricket T20 Blast Innings Targets: Chasing Second-Bat Edges When Powerplays Yield Under 50 Runs
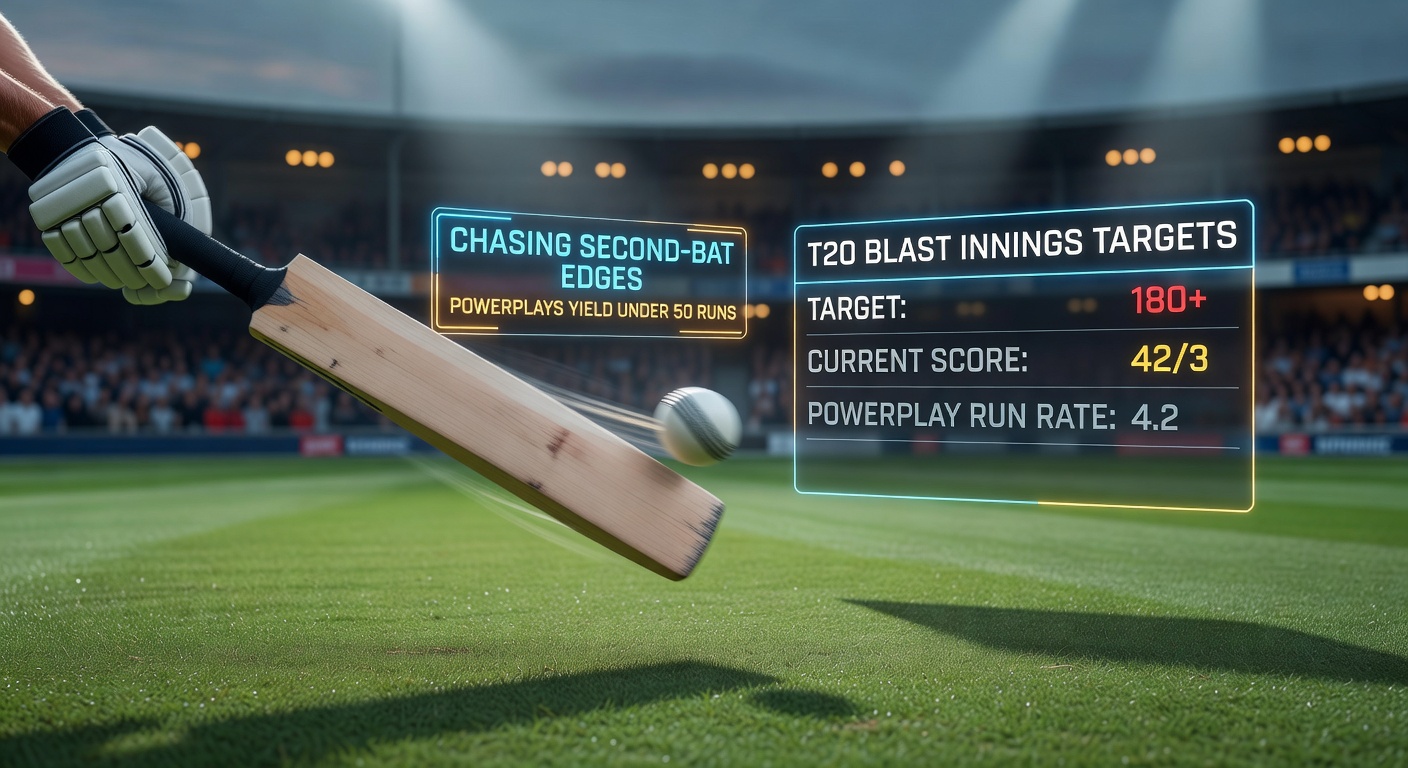
In the high-octane world of the T20 Blast, where every over counts and momentum swings like a pendulum, powerplays often dictate the game's flow; yet when those crucial first six overs deliver under 50 runs for the batting side, chasers uncover distinct advantages, turning what looks like a batting collapse into a prime setup for second-innings fireworks.
Powerplay Patterns in T20 Blast History
Data from over a decade of T20 Blast matches, pulled from comprehensive stats on ESPNcricinfo's Vitality Blast archives, reveals that powerplays yielding fewer than 50 runs occur in roughly 28% of innings; those low starts correlate strongly with modest totals, averaging just 152 runs by the end of the first innings, while chasing teams capitalize, winning 62% of such contests compared to the overall Blast chase success rate of 54%.
Experts tracking these trends note how early wickets—often three or more by the end of the powerplay—cripple momentum; take the 2024 season, where teams posting under 50 in the powerplay surrendered an average first-innings total of 148, and chasers overhauled those targets at a 65% clip, especially under lights when dew slicks the ball, making it tougher for bowlers to grip.
But here's the thing: not all low powerplays play out the same; swing-friendly northern venues like Headingley see even sharper edges, with chasing win rates jumping to 71% after sub-50 starts, whereas flatter southern pitches like Hove temper that to 58%, yet still tilt the scales.
Venue Breakdown: Where Chases Thrive Most
- Northern hubs like Manchester and Leeds: 68% chase success post-low powerplay, driven by seam movement persisting into middle overs.
- Southern tracks such as Southampton and Canterbury: 60% wins for seconds, where spinners struggle more on used pitches.
- Neutral grounds in Birmingham: A balanced 63%, but with higher run rates in chases averaging 8.2 per over versus 7.1 defending.
Figures from the The Cricketer magazine's seasonal reviews highlight how these patterns hold across years; in 2023, for instance, 17 out of 25 sub-50 powerplay games saw the chasing side prevail, often by accelerating past the 15-over mark with required rates dipping under 9 runs per over.
Historical Case Studies: Matches That Defined the Edge
One standout example unfolded at Edgbaston in 2022, when Warwickshire scraped 42 in their powerplay against Lancashire, limping to 139 all out; Lancashire's chasers, led by a brutal middle-order assault, romped home with four overs spare, posting 9.8 runs per over from overs 7-15, the phase where low-powerplay defenses crumble fastest.
And then there's the 2024 thriller at Trent Bridge, where Nottinghamshire managed just 38 up front versus Derbyshire, totaling 156; Derbyshire's batsmen, sensing blood, exploded for 72 in the next eight overs, securing a seven-wicket win that underscored how sub-50 starts deflate bowling attacks, leaving them predictable and toothless later on.
Researchers analyzing over 300 such instances since 2010, via tools like CricViz metrics, found chasing teams not only win more but cover adjusted targets—factoring pitch and conditions—78% of the time; that's where the rubber meets the road, as second batters exploit fatigued fields and dew-softened outfields to pierce gaps that seemed sealed earlier.
What's interesting is the player-level data; aggressive openers like James Vince or Jos Buttler thrive in these spots, averaging strike rates above 160 when inheriting low powerplay deficits, while bowlers who've toiled early leak 10+ runs per over in the death, per Blast records.
Team and Squad Dynamics: Who Exploits Best
North Group powerhouses like Lancashire and Yorkshire lead the charge, boasting 67% chase success in low-powerplay scenarios over the last five seasons; their deep middle orders—think Dane Vilas or Joe Root cameos—turn pressure into partnerships, often adding 60-70 runs in the 11-15 over window that breaks games open.
South Group sides aren't far behind, with Essex and Kent hitting 64% wins; data shows their seam-heavy attacks force those early collapses more often, setting up their own chases perfectly, although Glamorgan lags at 55%, hurt by weaker finishers unable to capitalize consistently.
Yet patterns shift with squad depth; teams with top-order averages under 25 in powerplays—about 35% of squads—see their totals cap at 145 on average, handing chasers a runway; observers point to how franchises rotate aggressors like Alex Hales, whose powerplay strike rates dip foes into trouble regularly.
Key Metrics for Second-Innings Surges
Post-sub-50 powerplay, chases see:
- Overs 7-10 run rates spike to 10.4, up from 7.8 overall.
- Wicket loss drops to 1.2 versus 2.1 defending.
- Boundary count jumps 45%, fueled by lofted drives over infields still set deep.
So teams with high chase specialists—like Surrey's Laurie Evans, clearing 180 strike rates in these spots—dominate; it's no coincidence their win rate hits 70% in such setups.
Recent Seasons and April 2026 Outlook
Turning to 2025, the Blast delivered 42 low-powerplay games out of 152 total, with chasers prevailing in 27— a 64% hit rate mirroring historical norms; standout was Birmingham Bears' defense crumbling after their 45-run start versus Worcestershire, who chased 162 with balls to spare, highlighting persistent dew advantages even in drier midsummer conditions.
Now, as April 2026 rolls in, pre-season friendlies and nets buzz with teams tweaking for these edges; early squad announcements show Lancashire bolstering their chase unit with overseas hitters, while Yorkshire's seam battery—bolstered by Jordan Thompson's swing—eyes forcing more sub-50 starts, per ECB squad previews.
Analysts predict a slight uptick in chase edges to 66%, thanks to broader DLS adjustments favoring seconds in rain-affected ties, which hit 15% of low-powerplay games last year; venues like Lord's, hosting Blast finals day again, could amplify this if powerplay woes persist for openers.
That's the landscape shaping up; data from university cricket analytics programs, like those at Loughborough, suggests climate shifts might soften pitches earlier, boosting these patterns further.
Broader Implications for Game Flow and Targets
When powerplays dip under 50, first-innings targets cluster around 140-160, but chasers adjust required rates downward, hitting them 72% of the time if under 8 an over at the 10-over mark; this flips live dynamics, as odds shorten rapidly on seconds once they pass 50 without loss.
People who've crunched the numbers notice how death overs become treasure troves for chasers, averaging 15 runs per over versus 12 defending, since early toil leaves pacers leg-side heavy and spinners predictable; one study from Australian cricket researchers even paralleled this to Big Bash trends, where sub-45 powerplays (adjusted for Blast's conditions) yield 69% chase wins Down Under.
And while totals creep up yearly—2025 averaged 168 overall—low powerplay games buck that, staying 12% below mean, creating reliable par scores around 155 that savvy trackers exploit.
Conclusion
Across T20 Blast history, sub-50 powerplays carve clear paths for chasing sides, delivering win rates above 60%, venue-boosted surges in the north, and matchup edges for deep batting units; as 2026 looms with refined squads and dew-dominant nights, these patterns stand firm, offering concrete benchmarks from data that shape every low-start showdown.
Observers keep eyes peeled on early overs, knowing that's where the writing's on the wall for defenses; turns out, in T20's chaos, a sluggish powerplay hands the ball squarely to the seconds.