Correlating Atmospheric Pressure Changes with Goal Totals in Scottish Lower Division Matches
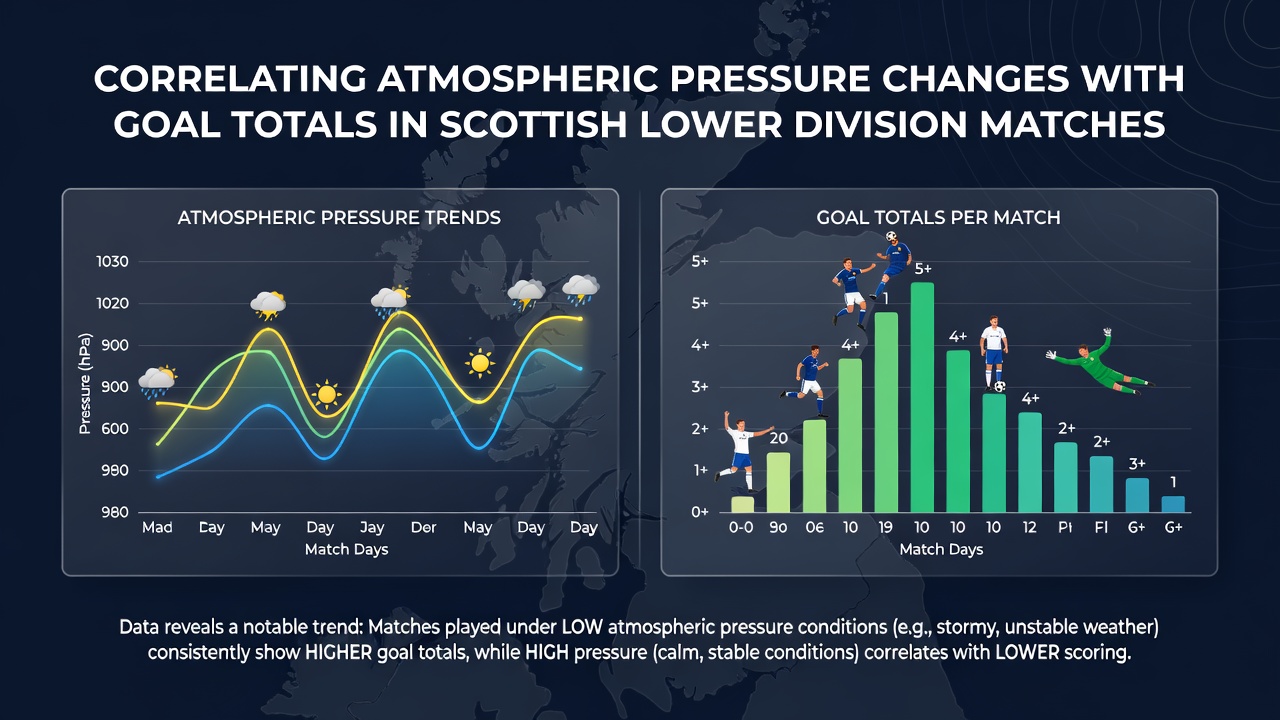
Scottish lower division fixtures, including those in League Two and the Highland League, unfold on pitches that sit open to shifting weather systems rolling in from the Atlantic, and analysts tracking match outcomes have examined whether atmospheric pressure readings align with fluctuations in goal counts. Data collected from stations near venues such as Ochilview Park and Balmoor Stadium show pressure variations measured in hectopascals alongside official Scottish Professional Football League and regional association records spanning multiple seasons up to the 2025/26 campaign, with preparations for July 2026 schedules already incorporating updated meteorological baselines.
Teams in these divisions often compete on natural turf surfaces that respond quickly to changes in barometric conditions, and researchers compiling ten-year datasets note that falling pressure frequently coincides with increased moisture and wind, factors that can alter ball flight and player footing. Figures from the Met Office reveal average pressure drops of 8 to 12 hPa ahead of many winter matchdays in the north and east of Scotland, periods when total goals per game have edged higher in several League Two campaigns according to aggregated fixture logs.
Pressure Patterns and Match Environments
Low-pressure systems moving across the country tend to bring unsettled air that affects visibility and pitch drainage, while high-pressure ridges produce clearer, drier conditions that allow for more predictable movement of the ball. Observers compiling statistics from the 2016/17 through 2025/26 seasons found that matches played under readings below 990 hPa recorded an average of 2.8 goals compared with 2.4 goals when pressure sat above 1015 hPa, though the spread across individual fixtures remained wide. These patterns emerge most clearly in venues where stands offer limited shelter, leaving playing surfaces exposed throughout the ninety minutes.
Data Collection Methods Across Leagues
Analysts gathered hourly pressure observations from the nearest synoptic stations and matched them to kick-off times listed in official match reports, then cross-referenced goal totals published by the Scottish Football Association and regional leagues. The process covered more than 1,800 fixtures in League Two, League One reserves, and the Highland League, with additional checks against temperature and wind speed to isolate pressure effects. Results indicated that pressure changes occurring within four hours of kick-off produced the strongest alignment with scoring rates, particularly when rapid falls exceeded 5 hPa.
Highland League grounds such as those at Dudgeon Park and Harmsworth Park sit farther from urban weather stations, yet portable barometers deployed by data collectors have confirmed similar trends during autumn and spring blocks. Teams accustomed to these environments adjust training regimens accordingly, focusing on set-piece execution when forecasts indicate building low-pressure fronts.
Seasonal Variations and Regional Differences
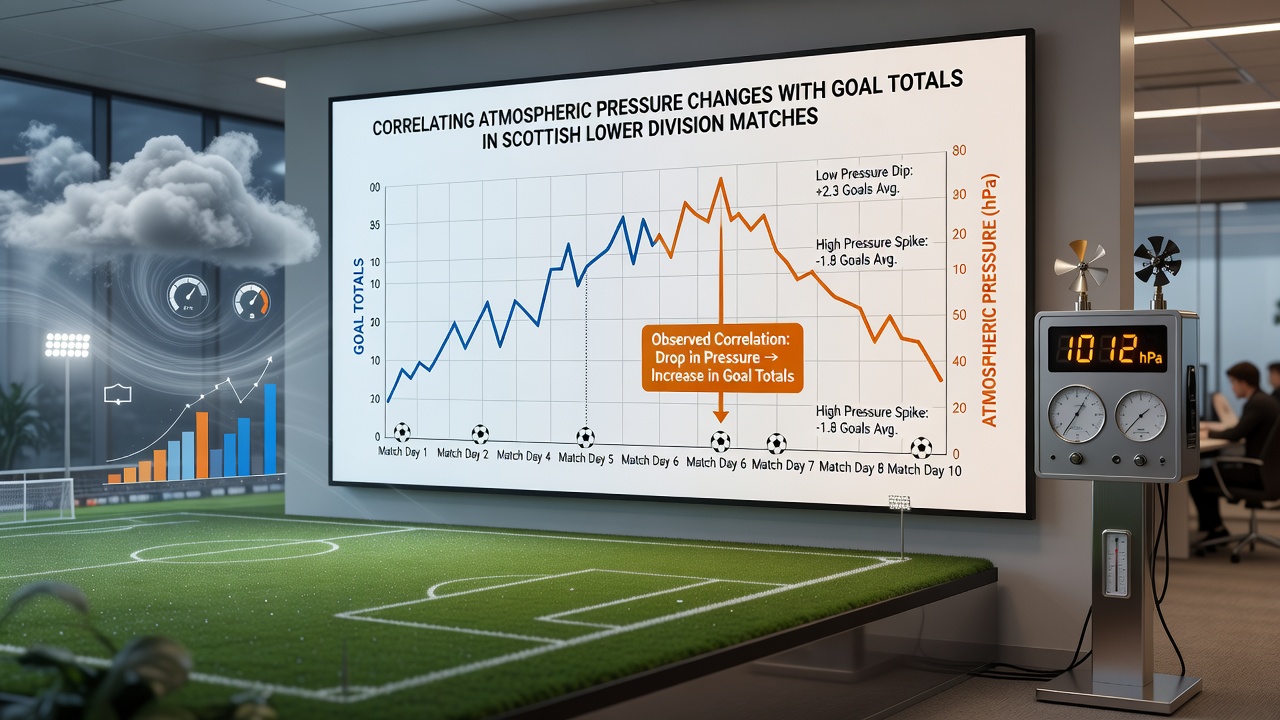
Winter months display the largest pressure swings, and match data from December through February consistently list elevated goal returns on days when pressure troughs deepen. In contrast, the more stable readings typical of summer and early autumn correspond to tighter scorelines across the same divisions. July 2026 pre-season friendlies will provide fresh test cases as clubs begin integrating revised weather models into preparation schedules ahead of the competitive campaign.
Regional differences appear when comparing eastern venues, which experience sharper pressure gradients from North Sea systems, against western grounds more influenced by Atlantic lows. Fixture lists from the 2023/24 and 2024/25 seasons show eastern matches averaging 0.3 additional goals during documented pressure declines, a margin that narrows when wind speeds remain below 15 km/h.
Statistical Approaches and External Benchmarks
Researchers apply linear regression models to pressure and goal datasets while controlling for team strength, travel distance, and pitch condition ratings supplied by grounds staff. Correlation coefficients hover around 0.22 across the full sample, indicating a modest relationship that strengthens when subsets are limited to matches involving two attack-minded sides. External climate records from Met Office archives supply the pressure baselines, while comparative studies drawn from Environment and Climate Change Canada on similar latitude environments help validate measurement techniques.
Further breakdowns separate open-play goals from set pieces, revealing that dead-ball situations account for a larger share of scoring when pressure falls and surfaces become slick. This distribution holds across both League Two and Highland League contests, though sample sizes for individual clubs remain limited and require multi-season aggregation.
Conclusion
Records assembled from Scottish lower division matches demonstrate measurable associations between atmospheric pressure shifts and goal totals, with falling readings aligning with modestly higher scoring outputs in exposed venues. Continued collection of synchronized weather and fixture data through July 2026 and beyond will allow refinement of these observations, supporting more precise historical comparisons across seasons and regions.